
Thursday, October 30, 2014
Observed enhanced greenhouse effect
In 2001, Harries et al published an article claiming to infer changes in greenhouse radiative forcing from changes in the Outgoing Longwave Radiation (OLR). Here is the crucial data from that paper:
The graph shows the difference in OLR between April-June, 1970 and April-June 1997 over the eastern central tropical pacific (10 S to 10 N; 130-180 W). It shows that the OLR has increased slightly (top), but that the observed increase was matched by an predicted increase in the models (middle). The graphs are offset to allow easy comparison.
Saturday, October 4, 2014
The straight line hockey stick
This is an extended post from Skeptical Science. It discusses where I am at in dissecting McIntyre and McKitrick (2005). That is something I had been holding of on until I completed the analysis, but I raised some points of the analysis in discussion at And Then There's Physics, so thought a fuller statement of the results to date was in order. Full discussion below fold:
Friday, September 12, 2014
Some knowledge is not certain (or why the spurious rejection of reasonable inductive inferences is itself a fallacy of reasoning)
One of the common themes of the creation wars and the climate war is the attempt by the anti-science side of each debate (ie, creationists and AGW deniers) to make their position appear more reasonable than it is by arguing that it is accepted by a large number of scientists. Thus we have lists of scientists who do not accept evolution such as that compiled by the Discovery Institute, and equivalent lists of scientists who do not accept Anthropogenic Global Warming such as the OISM petition from the forces of anti-science.
To counter this spurious argument, defenders of science have emphasized how small a proportion of scientists accept these pseudo-scientific positions. The NCSE does this with some humour, through their Project Steve. Defenders of the theory of AGW are a bit more dour, and have produced a series of surveys and other studies showing that rejection of AGW is confined to about 3% of climate scientists.
The curious thing is that these studies are rejected in turn by AGW deniers as an appeal to authority, ie, and invalid argument. Their intention is nothing of the sort. Rather, they are a rebuttal of the spurious appeal to authority represented by such phenomenon as the OISM petition. Ignoring that important subtlety, however, the fact remains that an appeal to relevant authority is in fact a valid way of justifying beliefs. I recently explained why in some detail in a comment at Skeptical Science, which is reproduced with minor editing below the fold.
Thursday, August 28, 2014
Schnidejoch and global warming
Recent retreats in ice in the Alps due to global warming have resulted in a number of interesting archological finds, of which the most famous is the "ice man", Otzi. Less famous are the finds in Schnidjoch Pass. These have been purported by AGW deniers to prove that the Alps were warmer in the past when the artifacts found in Schnidejoch were dropped by their former owners. In fact, the logic is exactly the reverse - these artifacts prove Schnidejoch to have been colder throughout the last 6000 years than it has been in the early twenty-first century. Here is a detailed explanation of why, from a recent comment at SkS. A follow on comment, not posted here, is also of interest.
Wednesday, August 13, 2014
The following is a comment made at SkS on the topic of how much new agricultural land will be made available in northern latitudes by global warming. It relies heavily on just one, twenty year old reference in an area in which I lack significant knowledge. It is posted primarily to provide a reference to two key sources of relevant data. I think my discussion is reasonable, but it should only used to provoke thinking on the topic rather than to take home conclusions.
Wednesday, August 6, 2014
Thoughts on McIntyre and McKitrick 05
The following is a comment published at And Then There's Physics. I am posting it here as a ready access source for me for the relevant links and commentary on M&M05:
Friday, February 7, 2014
Winter in the United States
Roy Spencer reports on the recent temperatures in the CONtiguous United States (CONUS). What is missing from his report is the relevant context. First, the CONUS represents just 1.6% of the Earth's surface. So small a part tells us little about global temperature change. It does not tell us, for example whether the very warm temperatures in parts of Canada and Alaska (1.1%), or record breaking warm temperatures in Australia (0.6%) have balanced those in the CONUS or not. It certainly does not tell us what is happening to the other 96.7% of the Earth's surface.
Second, Spencer is not reporting official United States Historical Climate Network (USHCN) figures, but his own figures which use a larger Urban Heat Island (UHI) adjustment than do the official figures. While we cannot be certain as to the correct adjustment for UHI and other factors, recently the accuracy of the USHCN adjustments have been corroborated from an independent source.
Third, he is only reporting on two winter months. Individual months are always more variable than annual figures, which have some of the variations cancelled out be averaging. Consequently it is not surprising that a two month period should be unusually cold, even with the background of a warming trend. It makes such comparisons mere curiosities, having no bearing on the long term change in temperatures. Spencer shows a graph of his adjusted Integrated Surface Hourly (ISH) figures compared to the official USHCN figures:
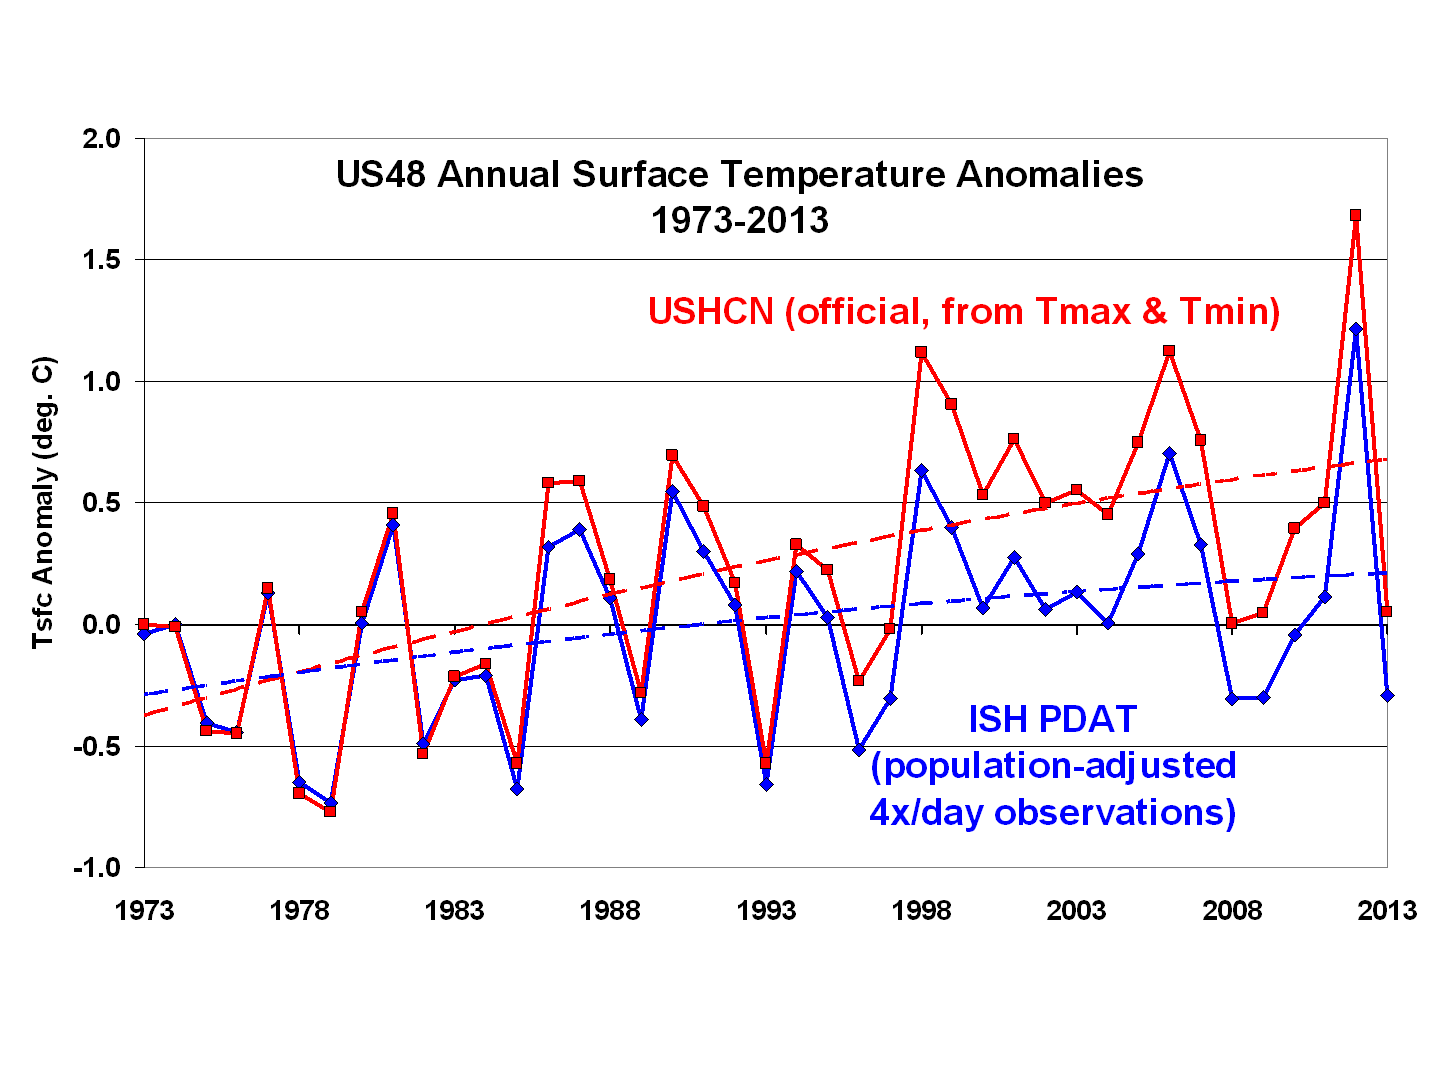
It can be seen clearly that Spencer's adjustment significantly cools later years relative to earlier years. Indeed, by 2013, it cools it by 0.35 C. As it turns out, that does not make a large difference in the ranking of 2013, which is the 13th coldest of 41 years in his adjusted figures, whereas it is tied for 15th and 16th coldest in the official USHCN data over that 41 years. Of course, the USHCN has many more years on record than just 41, and most of them much colder. Further, the early years of the 41 Spencer shows are obviously colder than the later years. Indeed, 8 of the first 15 years shown are colder than 2013.
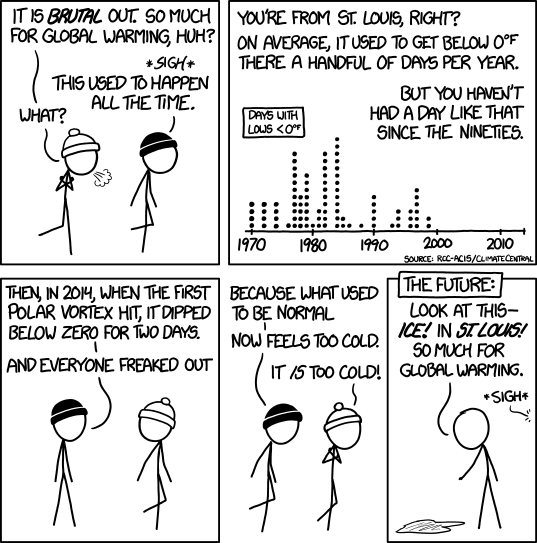
That brings to mind a recent comic by xkcd:
Which brings us to the December/January figures ;)
In those figures, Spencer shows that Dec/Jan of 2013/2014 have indeed been cold relative to the last 41 years, being the 6th coldest out of 41 years data. And it was indeed cold, at a chilly -0.55 C average for the CONUS. Of course, relatively warm relative to the -2.1 C in 78/79. And the years before that were colder still. What was commonplace has simply become note-worthy due to the warming climate. XKCD has it right.
(Note: This post is an edited and expanded version of an original comment at Skeptical Science.)
Second, Spencer is not reporting official United States Historical Climate Network (USHCN) figures, but his own figures which use a larger Urban Heat Island (UHI) adjustment than do the official figures. While we cannot be certain as to the correct adjustment for UHI and other factors, recently the accuracy of the USHCN adjustments have been corroborated from an independent source.
Third, he is only reporting on two winter months. Individual months are always more variable than annual figures, which have some of the variations cancelled out be averaging. Consequently it is not surprising that a two month period should be unusually cold, even with the background of a warming trend. It makes such comparisons mere curiosities, having no bearing on the long term change in temperatures. Spencer shows a graph of his adjusted Integrated Surface Hourly (ISH) figures compared to the official USHCN figures:
It can be seen clearly that Spencer's adjustment significantly cools later years relative to earlier years. Indeed, by 2013, it cools it by 0.35 C. As it turns out, that does not make a large difference in the ranking of 2013, which is the 13th coldest of 41 years in his adjusted figures, whereas it is tied for 15th and 16th coldest in the official USHCN data over that 41 years. Of course, the USHCN has many more years on record than just 41, and most of them much colder. Further, the early years of the 41 Spencer shows are obviously colder than the later years. Indeed, 8 of the first 15 years shown are colder than 2013.
That brings to mind a recent comic by xkcd:
Which brings us to the December/January figures ;)
In those figures, Spencer shows that Dec/Jan of 2013/2014 have indeed been cold relative to the last 41 years, being the 6th coldest out of 41 years data. And it was indeed cold, at a chilly -0.55 C average for the CONUS. Of course, relatively warm relative to the -2.1 C in 78/79. And the years before that were colder still. What was commonplace has simply become note-worthy due to the warming climate. XKCD has it right.
(Note: This post is an edited and expanded version of an original comment at Skeptical Science.)
Saturday, January 4, 2014
Shrinking the carbon footprint
Lindsay of Shrink explains the task ahead of us in terms of lego:
(h/t to my daughter)
Subscribe to:
Posts (Atom)