Roy Spencer reports on the recent temperatures in the CONtiguous United States (CONUS). What is missing from his report is the relevant context. First, the CONUS represents just 1.6% of the Earth's surface. So small a part tells us little about global temperature change. It does not tell us, for example whether the very warm temperatures in parts of Canada and Alaska (1.1%), or record breaking warm temperatures in Australia (0.6%) have balanced those in the CONUS or not. It certainly does not tell us what is happening to the other 96.7% of the Earth's surface.
Second, Spencer is not reporting official United States Historical Climate Network (USHCN) figures, but his own figures which use a larger Urban Heat Island (UHI) adjustment than do the official figures. While we cannot be certain as to the correct adjustment for UHI and other factors, recently the accuracy of the USHCN adjustments have been corroborated from an independent source.
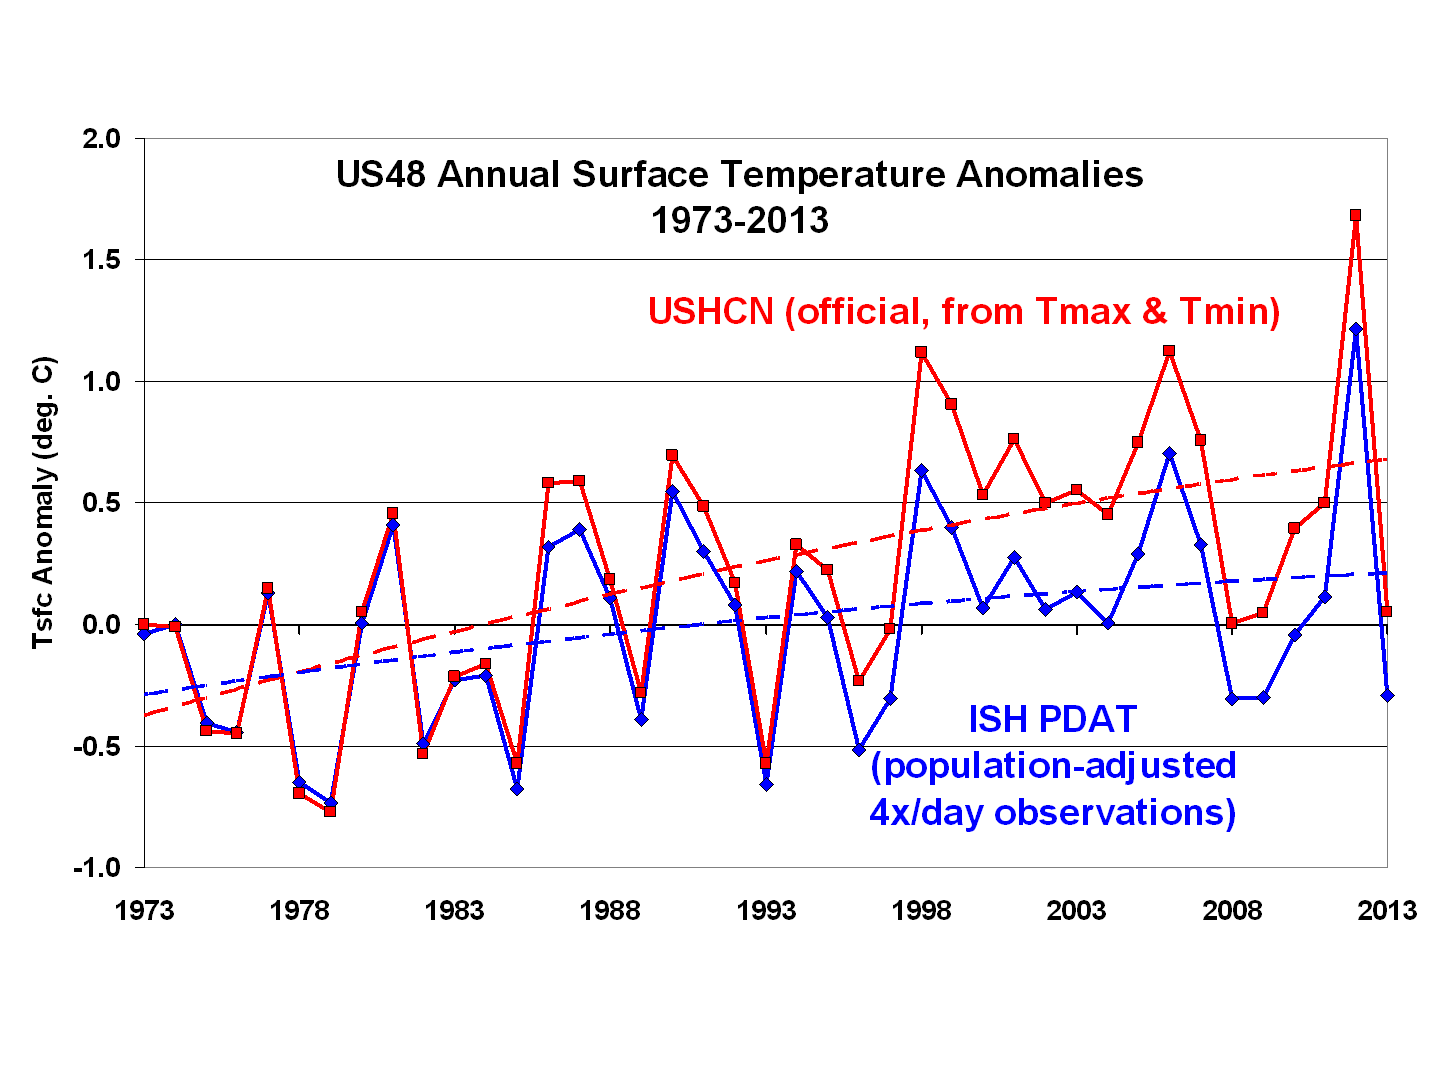
Third, he is only reporting on two winter months. Individual months are always more variable than annual figures, which have some of the variations cancelled out be averaging. Consequently it is not surprising that a two month period should be unusually cold, even with the background of a warming trend. It makes such comparisons mere curiosities, having no bearing on the long term change in temperatures. Spencer shows a graph of his adjusted Integrated Surface Hourly (ISH) figures compared to the official USHCN figures:
It can be seen clearly that Spencer's adjustment significantly cools later years relative to earlier years. Indeed, by 2013, it cools it by 0.35 C. As it turns out, that does not make a large difference in the ranking of 2013, which is the 13th coldest of 41 years in his adjusted figures, whereas it is tied for 15th and 16th coldest in the official USHCN data over that 41 years. Of course, the USHCN has many more years on record than just 41, and most of them much colder. Further, the early years of the 41 Spencer shows are obviously colder than the later years. Indeed, 8 of the first 15 years shown are colder than 2013.
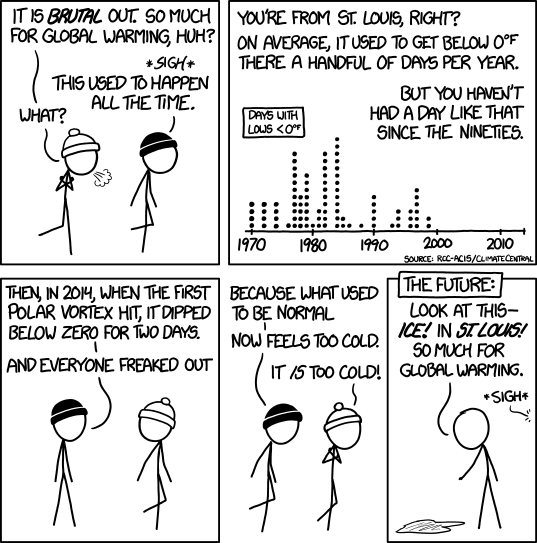
That brings to mind a recent comic by xkcd:
Which brings us to the December/January figures ;)
In those figures, Spencer shows that Dec/Jan of 2013/2014 have indeed been cold relative to the last 41 years, being the 6th coldest out of 41 years data. And it was indeed cold, at a chilly -0.55 C average for the CONUS. Of course, relatively warm relative to the -2.1 C in 78/79. And the years before that were colder still. What was commonplace has simply become note-worthy due to the warming climate. XKCD has it right.
(Note: This post is an edited and expanded version of an original comment at Skeptical Science.)

